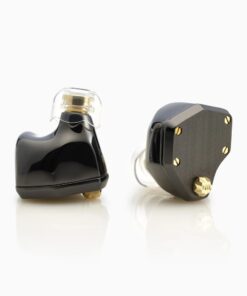
 Sleeping
 Concerts
 Motorcycle
 Swimming
 Work
 Kids

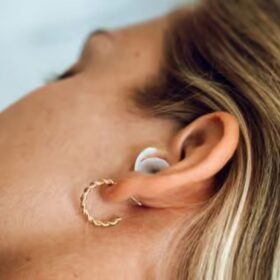

 On stage
 In the studio
 Rehearsals
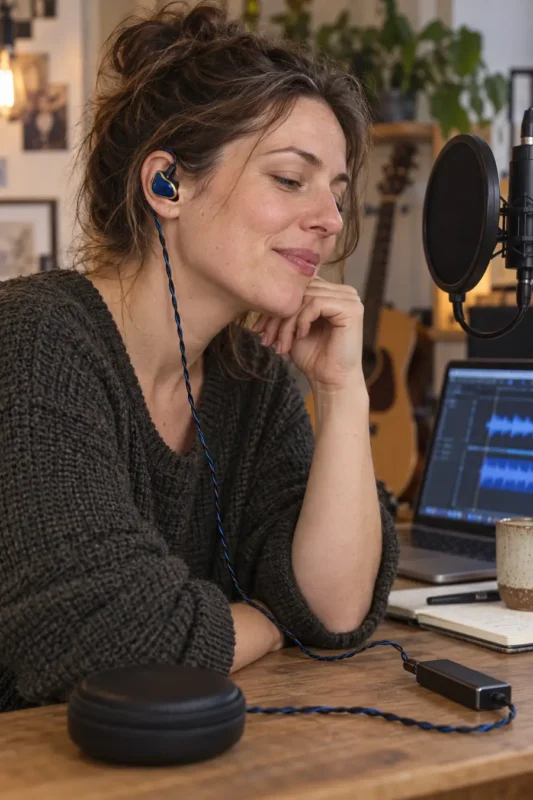 Writing music
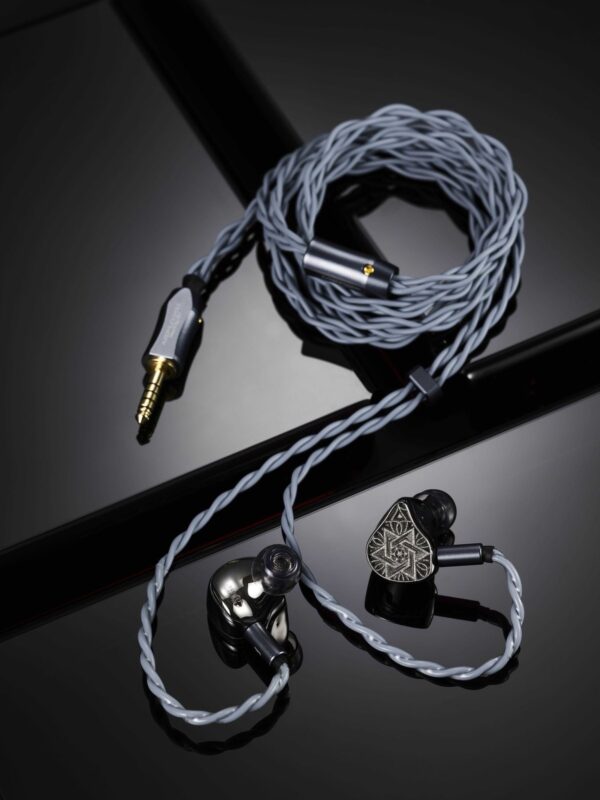 Mixing at home
 Daily commute
 Long journeys
 Listening at home
⏱️ Estimated reading time: 12 min
On this page: Overview
Key Takeaways
Read frequency left to right on the bottom axis, from deep bass at 20 Hz to treble at 20 kHz, and relative level in decibels on the side axis. Then check the smoothing, the rig and the target curve before you compare the shape of the line region by region.
It is a frequency response curve developed by Harman researchers from blind listening tests. In their 2017 AES study, 71 trained and untrained listeners rated 30 in-ear models, and both groups preferred the in-ear equalised to the Harman target. It describes an average preference, not a rule for every listener.
Only partly. A graph shows tonal balance on one measurement rig with one tip at one insertion depth. It does not show fit, comfort, timing behaviour, what a bone-conduction driver adds or how your own ear canal shapes the treble, so read it as a map rather than a verdict.
The graph was measured on an ear simulator, not in your ear. A weaker seal than the rig’s lowers the bass, a different insertion depth moves the treble peaks, and your ear canal is not the simulator’s. A different tip or a deeper fit often brings the sound closer to the published curve.
Knowing how to read an IEM frequency response graph turns a squiggly line into something useful when you choose earphones. The graph plots how loud an in-ear monitor plays each frequency compared with the others. Most guides explain the axes and stop. We also look at what the graph leaves out.
At Bollsen we are the official UK and EU partner of Unique Melody, so graphs and spec sheets come up in a lot of the questions we get. We do not publish our own measurements; we point you to independent databases. If the category is new to you, our explainer what are in-ear monitors covers the basics first.
Keep one thing in mind: the graph does not show your unit, in your ear, with your ear tips.
What do the axes and smoothing on an IEM graph show?
The x-axis shows frequency in hertz on a logarithmic scale, usually from 20 Hz to 20 kHz, and the y-axis shows relative level in decibels, so the line tells you which frequencies an IEM plays louder or quieter than others, not how loud it plays overall. Crinacle’s Graphs 101 guide to reading headphone measurements sums it up in one line: the y-axis represents volume, while the x-axis represents frequency.
The log scale gives each octave the same width. Graphs are also normalised, meaning curves are shifted up or down so they line up at one point. Many line up at 1 kHz, though Crinacle notes there is no hard-and-fast rule.
Smoothing averages out narrow wiggles and is written as “1/X octave smoothing”. The lower the X, the heavier the smoothing, so a 1/3-octave curve looks far calmer than a 1/24-octave one.
What does a frequency range like 20 Hz–70 kHz on a spec sheet mean?
A stated frequency response range such as 20 Hz–70 kHz says how far the response is claimed to extend, not how the IEM is tuned or how good it sounds. A graph shows the shape of the response inside the audible band, and that shape is what you hear as bass weight, vocal presence or treble sparkle.
Unique Melody’s product pages list the following ranges. The MEST Jet Black and the MEST MKIII CF Blue both state 20 Hz–70 kHz, while the MEST Fortune page states no range at all. Independent databases plot from 20 Hz to 20 kHz, so a 70 kHz figure sits well off the right edge of every graph you will read.
| Unique Melody model | Stated frequency response (product page) |
|---|---|
| From The Start, 2HT | Not stated |
| 3DT, Stardust | 20 Hz–20 kHz |
| MEXT | 20 Hz–23 kHz (bone conduction 200 Hz–7 kHz) |
| MEST MKII, MEST Jet Black | 20 Hz–70 kHz |
| MEST MKIII CF Blue | 20 Hz–70 kHz (bone conduction 500 Hz–16 kHz) |
| Maven III Moonshard, MEST Fortune | Not stated |
| The Multiverse Mentor, Mason FS | 20 Hz–40 kHz |
None of these figures ranks one model above another, and a page that states no range tells you nothing about the tuning either way.
What are target curves, and what is the Harman in-ear target?
A target curve is a reference response that a reviewer draws next to a measurement, or subtracts from it, to show how an IEM differs from a chosen idea of neutral. The two you will meet most are the diffuse-field target and the Harman in-ear target.
The Harman target comes from listening research. In the 2017 AES paper Olive, Welti and Khonsaripour on in-ear headphone preference (Paper 9840), 71 trained and untrained listeners rated 30 in-ear models, and both groups preferred the in-ear equalised to the Harman target. The further a model’s response strayed from that target, the less it was generally preferred.
That is an average, and one forum user called the target “good for a reference point” but not something to equalise to. Compared with a diffuse-field curve, Harman-style targets add a broad lift in the bass, the bass shelf you will see on most modern graphs.
Graphs also come raw or compensated. A raw graph shows what the microphone recorded, with a target drawn alongside, while a compensated graph has a target subtracted so that “flat” means “matches the target”. Crinacle warns that flat on a raw graph does not mean the sound is flat.
Which regions of the graph should you look at?
Read the graph in five regions: sub-bass, the bass shelf, the midrange, pinna gain at roughly 2–5 kHz and the treble and air above about 10 kHz. The Hz boundaries are approximate conventions, and Crinacle, whose split we use below, says there is no strict set of rules for where each range begins and ends.
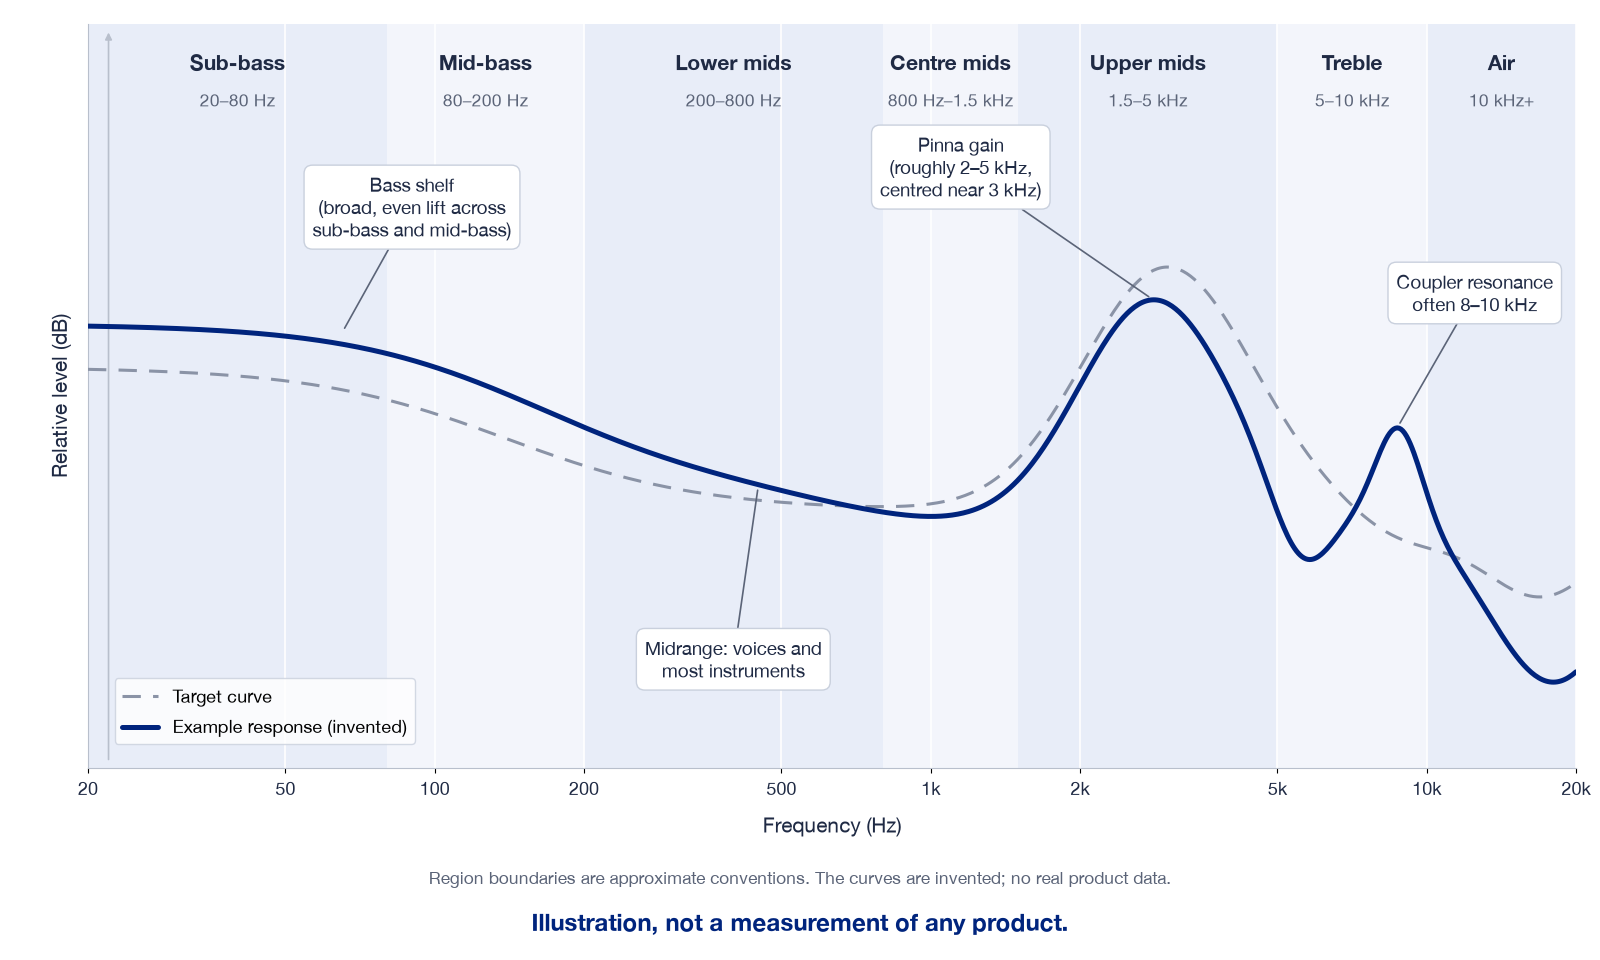
The graph above is an illustration, not a measurement of any product.
Sub-bass and the bass shelf
Crinacle puts sub-bass at 20–80 Hz and mid-bass at 80–200 Hz, where kick drums and bass guitars get their punch. A bass shelf is a broad, even lift across both rather than a narrow peak. A line that falls away below 100 Hz suggests a lean tuning or a poor seal on the rig.
The midrange
His split runs lower mids at 200–800 Hz, centre mids at 800–1,500 Hz and upper mids at 1,500–5,000 Hz. Voices and most instruments live here, and a hump in the lower mids can make a mix sound boxy.
Pinna gain at roughly 2–5 kHz
Almost every IEM graph rises to a broad peak somewhere around 2–5 kHz, centred near 3 kHz. This is pinna gain, or ear gain, and it is there on purpose: your outer ear and ear canal boost this region with any sound, so an IEM that skipped it would sound dull. Too little and vocals sound veiled; too much and they turn shouty.
Treble and air
Treble runs from 5 to 10 kHz and upper treble, often called air, sits above 10 kHz. It is also the least reliable part of any graph. HiFi Report notes that a coupler resonance commonly appears somewhere between 8 and 10 kHz on popular coupler designs, so do not over-read a single narrow peak there.
Why do two graphs of the same IEM look different?
Two graphs of the same IEM differ because they were made on different ear simulators, with different tips, insertion depths, normalisation points and smoothing. HiFi Report’s article on why two reviewers measure the same earphones and get different graphs describes a coupler as a small metal tube with a microphone at the far end.
Start with the rig. Many hobby databases use an IEC 60318-4 ear simulator, often called a 711 coupler, while headphones.com measures on a Brüel & Kjær Type 5128 and describes the 711 as less accurate below 1 kHz. Crinacle discourages comparing graphs across rigs, especially for headphones, and recommends the same rig and the same method.
Crinacle notes that a shallower insertion moves the main resonance lower in frequency and a deeper one moves it higher, and HiFi Report adds that a weak seal reduces the measured bass. Before you compare two curves, check the following.
- Same rig and coupler type, ideally the same reviewer.
- Same smoothing and the same normalisation point.
- Same type of graph: raw with a target, or compensated.
- Same axis scales, especially the decibel range.
What does a frequency response graph not tell you?
A frequency response graph does not tell you how an IEM will fit your ears, which ear tips will seal, what a bone-conduction driver adds, how the IEM handles timing and detail, or how your own ear canal changes the treble. The In-Ear Fidelity database itself warns that a frequency response graph is not in any way an indication of good sound quality.
Fit comes first, because the seal decides how much bass reaches you. Our guide to choosing IEM ear tips explains how size and material change that seal. The driver mix matters too, and IEM driver types explained covers what each family does.
Bone-conduction drivers need their own note. A coupler microphone measures sound pressure in the air, while a bone-conduction driver works by vibrating the shell, so count the part it adds as not shown on the graph. Unique Melody states a band for two models (200 Hz–7 kHz on the MEXT, 500 Hz–16 kHz on the MEST MKIII CF Blue), and our article on bone-conduction drivers in IEMs collects what reviewers report.
Timing is missing too, and one hifiguides forum user noted that FR measurements completely ignore time-domain behaviour. Then there are your own ears, and headphones.com notes that treble depends on the air volume between the eardrum and the IEM, which changes even between seatings of the same IEM.
Where can you find independent IEM measurements?
One widely used free source is the In-Ear Fidelity IEM graph database by Crinacle, whose measurements are raw and based on the IEC 60318-4 standard. It lists several Unique Melody models, including the 2HT, MEXT and MEST, measured independently of us.
For method, read headphones.com’s forum post Understanding the Headphones.com IEM measurements, which explains their B&K 5128 rig and their baseline target, JM-1. Squig.link, run by Super* Review, hosts further databases, each with its own targets, so compare within one database only.
We link to these sites rather than copying their curves or scores, because a graph only makes sense alongside the method of the person who measured it.
How much should a graph decide which IEM you buy?
Use a frequency response graph to shortlist a tonal balance, then decide on fit, plug, source and price. If you like weight in the low end, look for a clear bass shelf, and if vocals matter most, look for a smooth rise into pinna gain without a sharp spike.
Our guide on how to choose in-ear monitors in the UK takes you through fit, plug and source step by step. To compare all 12 models with photos and full UK terms, see our page for Unique Melody in-ear monitors (UK), and once the tips seal properly, let your own ears have the final say.